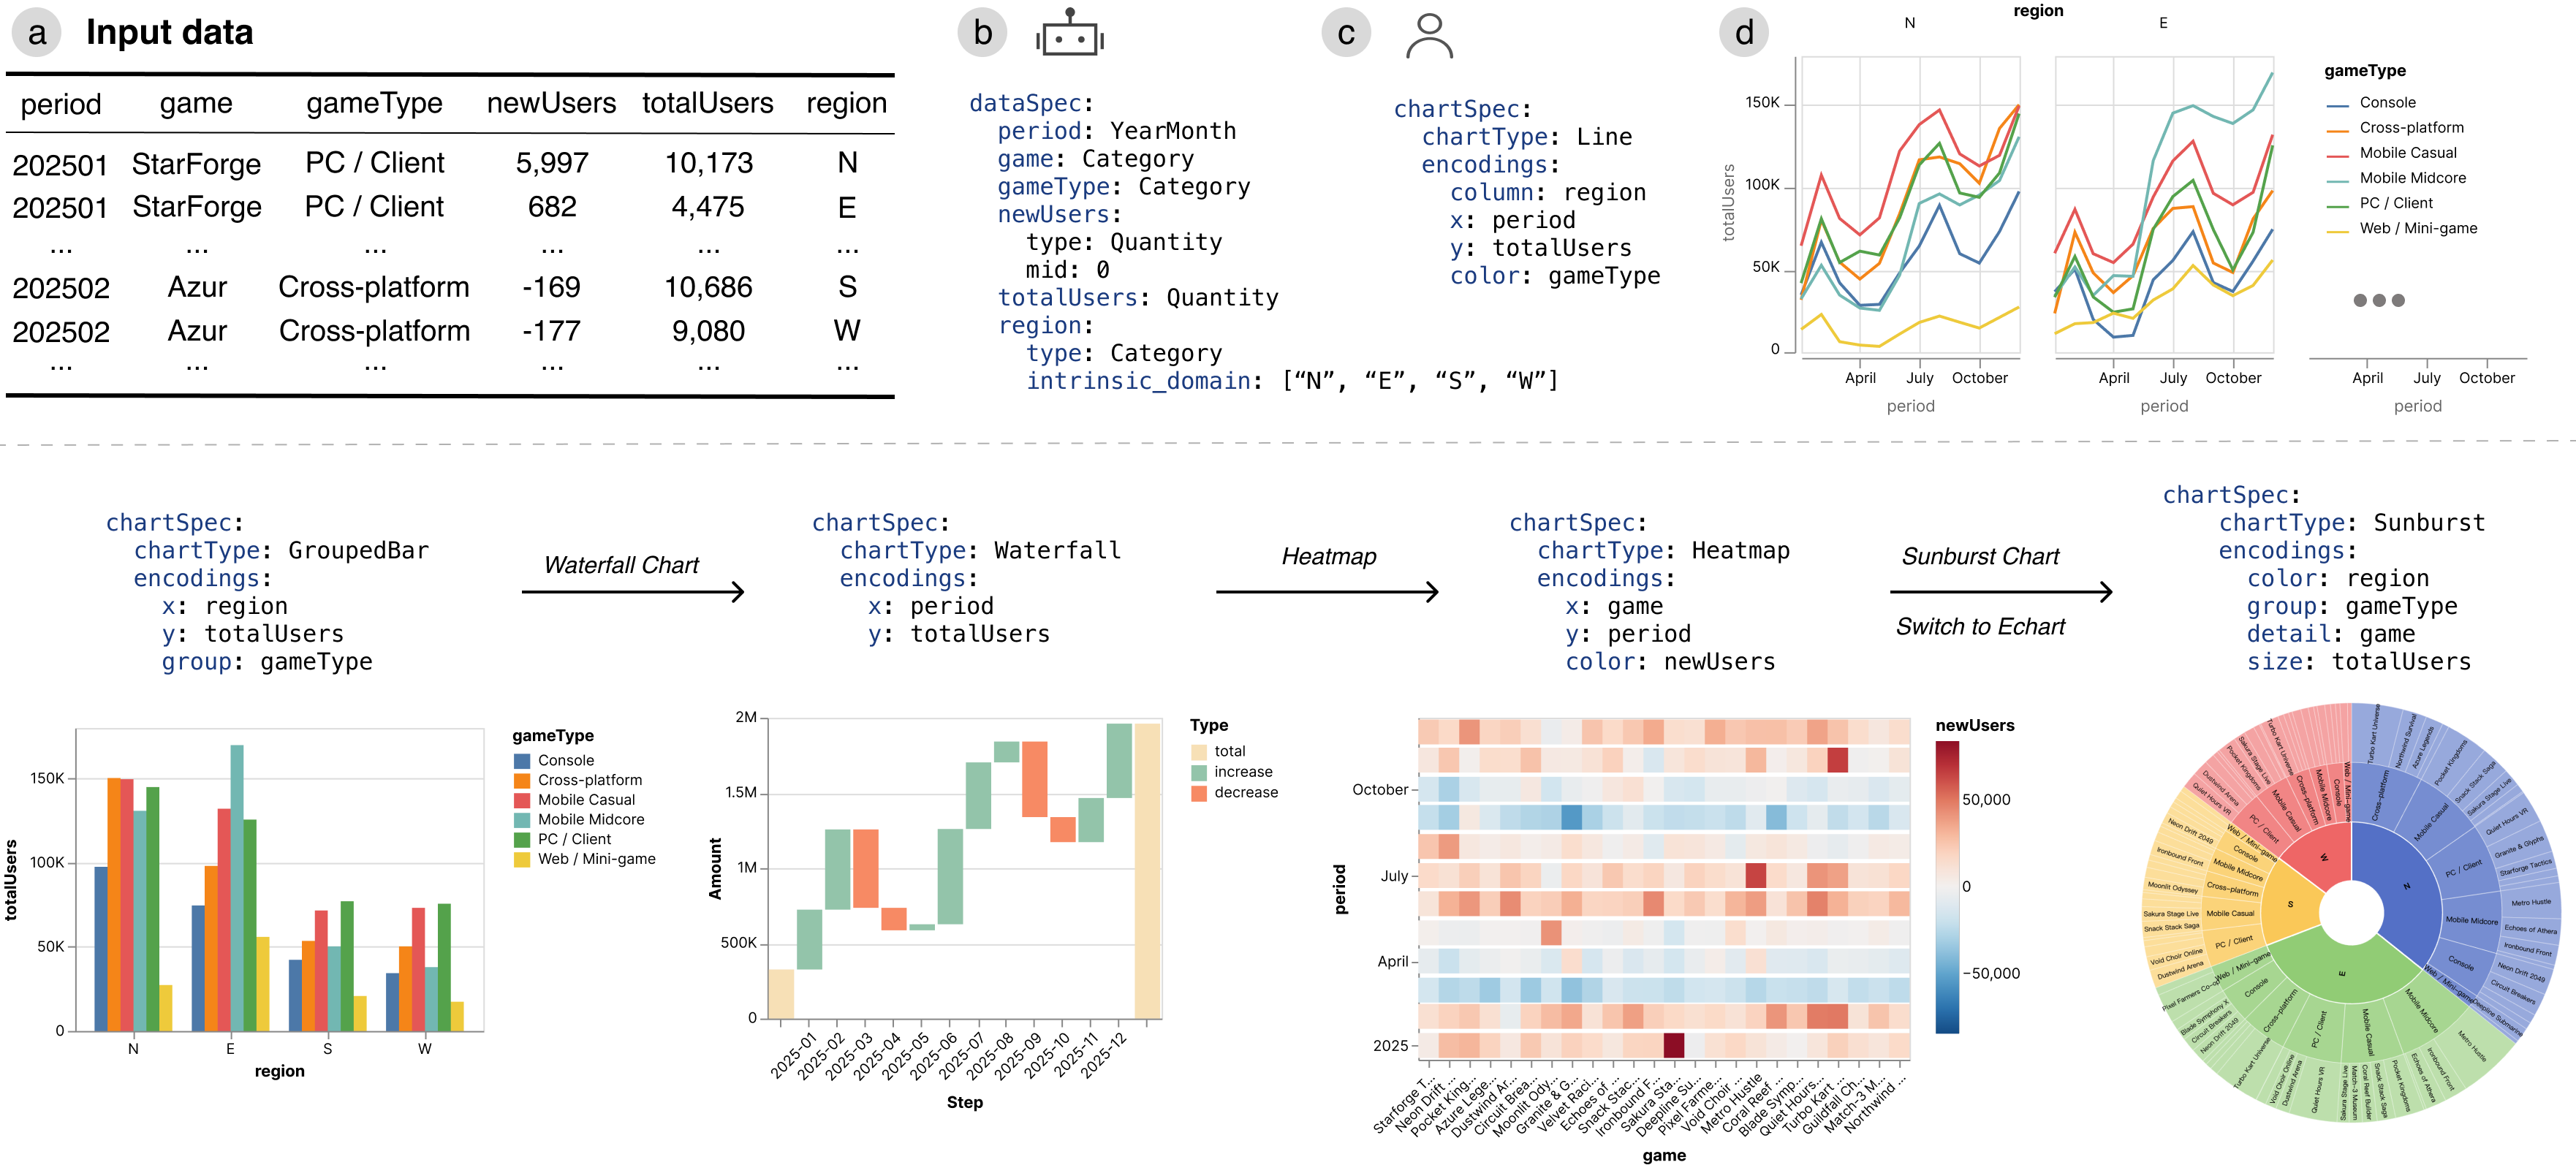
In our respective work, we were finding that visualizations generated by AI agents were done pretty well, but there were consistent ways in which the agents were failing to make a “good looking” visualization on the first try. A lot of these issues had to do with the failure of the agent to realize the rich semantics of the data it was visualizing. There appeared to be a missing link between data semantics, data characteristics (such as cardinality), and viewport size that commonly led to design failures. We realized that if we enforced specification of data semantics, this might actually make specifying visualization more concise, hiding data characteristic-specific design tweaks behind an abstraction.
This concision led us to make the hypothesis that such an abstraction may be beneficial for AI agents to make better-behaving charts quicker. Our main insight is that by providing this semantic type for all data fields, a chosen chart type, binding of data to chart encodings, and the available viewport, Flint can act as an intermediate layer to take a concise specification and output a fully-formed visualization specification for many lower-level visualization libraries. At the time of publishing, Flint can output specifications appropriate for include Vega-lite, ECharts, and Chart.js.
We’ve already started to integrate Flint in our own applications and work, and are excited to share its development with the community.
Check out the project website for examples and documentation, and don’t miss the gallery. Flint is available both as a npm library and a MCP server.
This work will be presented at IEEE VIS 2026 in Boston, Massachusetts, USA.
Selected buzz: