Accessibility of data visualizations is critical for people who are blind or low-vision, and current specified guidance for providing alt-text (e.g., ARIA) is not nearly engaging enough to allow people agency for exploring a data visualization. Progress has been made this area by allowing navigation through a representative data table, sonification of trends via tones, and various hierarchical descriptions and navigations. However, the combination and synthesis of these disparate techniques is still under-studied, and how these techniques should be combined to create a full data experience for screen reader users is underspecified.
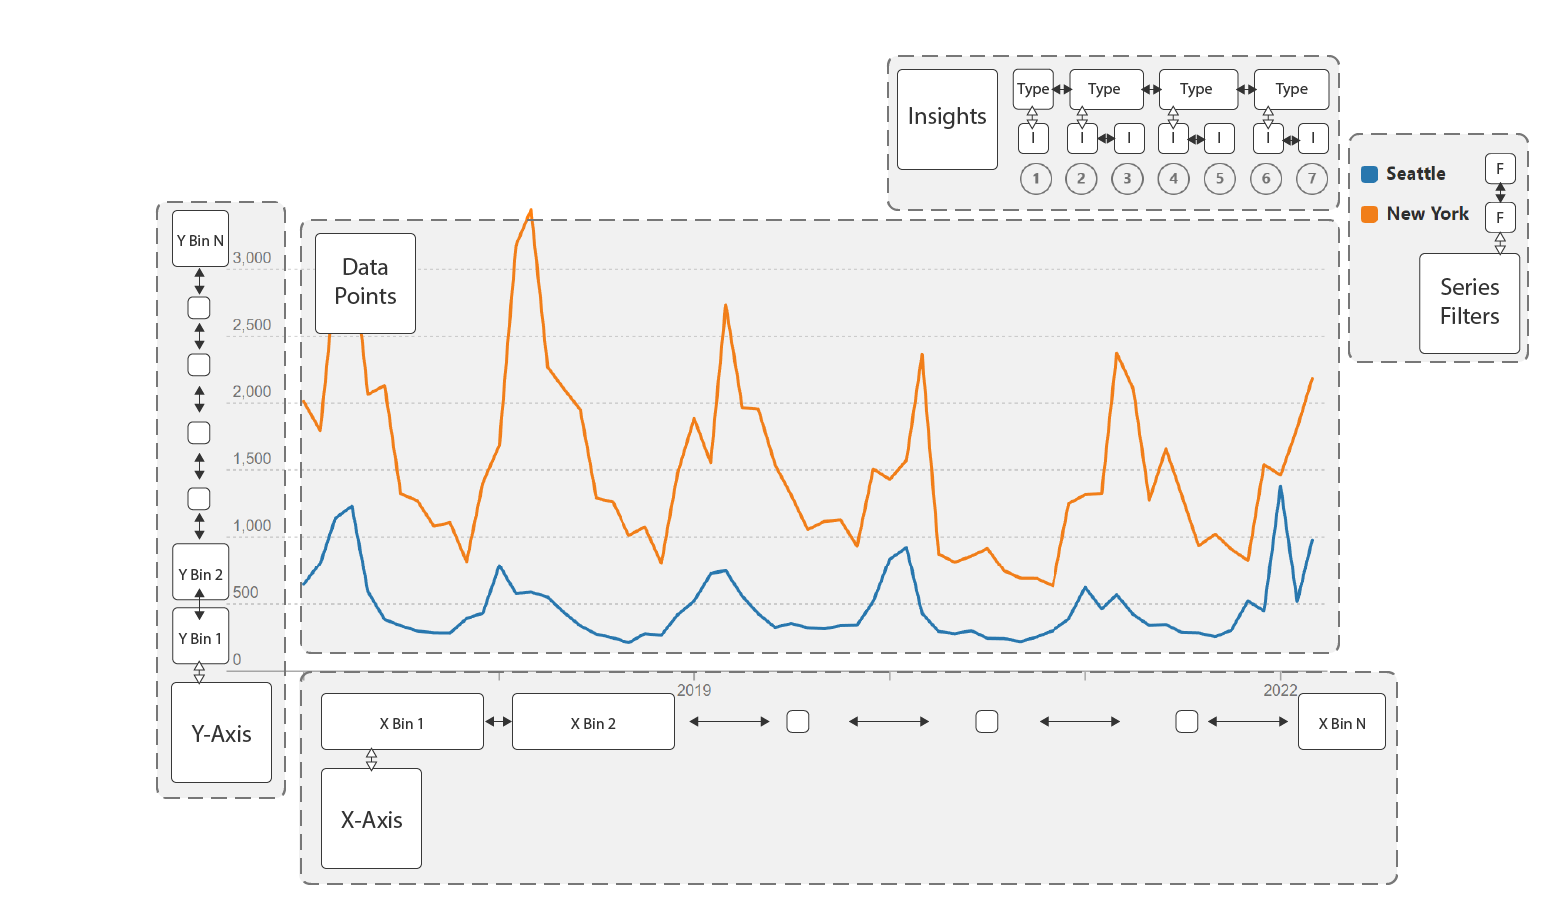
In this work, we present Chart Reader, a prototype accessibility engine that synthesizes hierarchical navigation, sonification, and cross-cutting insights to enable screen reader users to navigate and consume a data visualization as a data experience. We developed this prototype in concert with 10 design partners who are blind or have low vision, conducting an iterative co-design study to arrive at a more refined prototype that supported various, individualized experiences.
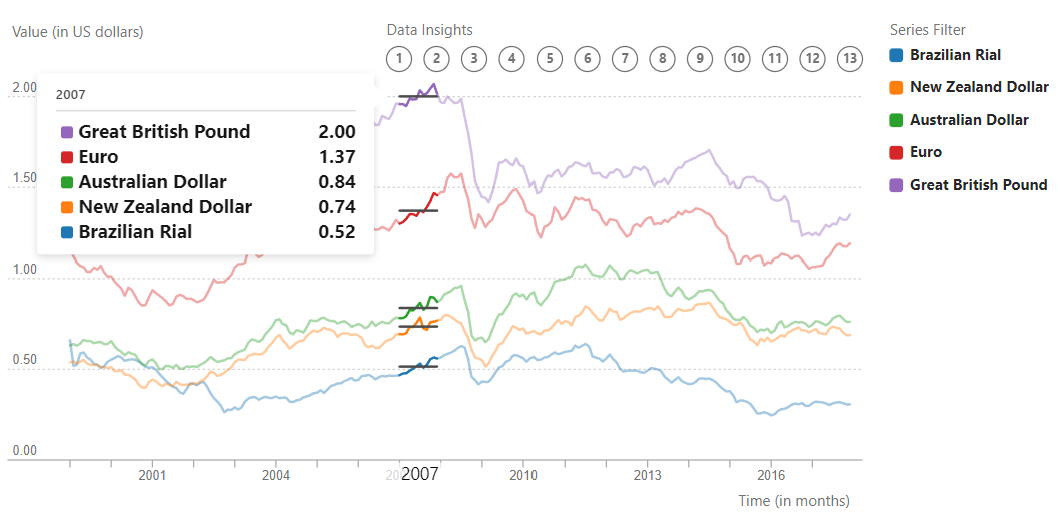
We describe several exemplar strategies of personas perusing a chart using Chart Reader, including strategies for using the Insights pane to quickly jump into and verify claims. We categorize tooling support into the design dimensions of structure, navigation, description, non-speech audio, and focus to concretize supporting the data experience. We also describe the suggestions, expectations, and difficulties our design partners provided throughout the three iterations of the Chart Reader prototype. It is our hope that such all-in-one engines like Chart Reader can help build an explorable data experience for all from a visualization representation.
Check out live examples on John’s webpage, and don’t miss the code on GitHub!
This work will be presented at ACM CHI 2023 in Hamburg, Germany.